Simon
Ioffe
Architecting, building, and proving enterprise AI solutions that deliver measurable business value.

Solving Complex Problems With Better Processes, Data, and AI
I'm a Senior Solutions Engineer with 14 years of experience across enterprise software, data platforms, and AI. I specialize in translating complex customer requirements into practical solutions, combining technical discovery, solution architecture, hands-on prototyping, and measurable evaluations.
My recent work focuses on enterprise AI search, RAG, agentic workflows, and applied LLM systems. I build with Python, JavaScript/TypeScript, SQL, and modern AI APIs, bringing together structured data, retrieval, deterministic logic, and AI models to solve real business problems.
I work across the full technical pre-sales cycle, from initial discovery and architecture discussions to custom demos, POCs, and executive presentations. My approach is evidence-driven: establish the problem, build a credible solution, measure the improvement, and communicate its value clearly.
Technical Pre-Sales
I am passionate about empathetically learning about customers' challenges and partnering with them to present the right solution. I excel at presenting and building out demos and integrations across a variety of industries to diverse audiences, both technical and non-technical, including C-suite executives and Fortune 500 companies.
Applied AI & Machine Learning
My technical foundation enables me to integrate complex datasets and design applied analytics and AI systems in cloud environments. I have experience developing ML and GenAI-enabled solutions and architecture plans that improve customer-facing experiences and operational decision-making with measurable outcomes.
Product Management
As a technical product manager, I bring an agile and process-oriented approach to managing platform, web, and internal tooling. My expertise in leading cross-functional teams has helped me deliver new launches and evolve complex existing products through clear scope, metrics, and cross-functional alignment.
Enterprise Solution Architecture
I design end-to-end solutions that fit a customer's data, systems, and constraints, spanning connectors and APIs, data and indexing pipelines, hybrid retrieval, AI enrichment, and LLM integration. I've architected cloud solutions across AWS, GCP, and Azure, from machine learning platforms at Iron Mountain to enterprise AI search at Lucidworks.
Experience
Fourteen years across search, AI, healthcare data and enterprise platforms.
 2023 — PRESENT
Senior Sales Engineer
2023 - Present
- Lead end-to-end technical pre-sales for enterprise AI search, RAG, knowledge management, and e-commerce, spanning technical discovery, architecture, POCs, competitive evaluations, security reviews, and executive presentations.
- Architect end-to-end solutions spanning APIs and connectors, indexing pipelines, structured data, hybrid retrieval, AI enrichment, LLM gateways, grounding, and citations.
- Build customer-specific AI applications combining APIs, structured data, hybrid search, query routing, deterministic logic, and grounded LLM workflows, optimizing relevance, quality, latency, cost, and implementation complexity.
- Designed an AI search evaluation framework comparing four retrieval strategies across 50 queries, improving nDCG@10 from 0.792 to 0.869 through chunking, hybrid retrieval, and AI enrichment.
- Turn field learnings into product requirements, reusable demo patterns, feature-gap analysis, and competitive insight for Product and Engineering.
 2022 — 2023
Pre-Sales Solutions Architect
2022 - 2023
- Built custom enterprise CDP demonstrations integrating SQL/Presto, Snowflake, Kafka, Python, and APIs, translating the platform's data integration and identity-resolution capabilities into customer use cases.
- Led presentations, product demos and provided technical consultations to prospects, helping to understand their needs and the capabilities and benefits of the software.
- Answered RFPs and conducted product development discussions, providing feedback and insights on customer needs and trends.
 2020 — 2022
Machine Learning Solution Architect
2020 - 2022
- Architected cloud-based (GCP) document intelligence solutions for financial-services clients, spanning document classification taxonomies, field extraction requirements, training-data schemas, and customer-specific mapping and gap analysis.
- Counseled customers as the lead technical product and machine learning expert to meet and exceed client business needs.
- Set priorities based on project requirements and serve as a technical escalation point to developer, ML, QA, DevOps, and support teams.
 2012 — 2020
Product Manager
2019 - 2020
- Owned and oversaw the execution of a platform to automate, scale and provide monitoring to support and aid implementation of Arcadia’s software and the integration & ETL of thousands of data sources.
- Managed the backlog and work queue & sprints for the platform back-end team and web team.
Technical Implementation Team Manager
2017 - 2019
- Managed twelve employees across two technical product implementation teams.
- Designed and developed custom D3.js dashboards and full-stack operational applications, visualizing ETL execution, data quality, processing timelines, and implementation capacity across enterprise healthcare environments.
- Chosen to be on an executive SWAT team to fully revamp and redevelop the implementation process within AWS, leveraging Spark, machine learning algorithms and a redesigned lean process workflow.
Solutions Architect
2015 - 2017
- Led client engagements to capture requirements, articulate Arcadia's technology capabilities, and devise customized architectural plans, ensuring alignment with clients' strategic objectives and successful product implementation.
- Established technical requirements and oversaw their completion across multiple teams.
- Created a predictive model to predict the likelihood of a patient being a no-show to a scheduled doctor’s appointment based on dozens of data points.
Senior Consultant
2013 - 2015
- Served as the tech lead onsite for a major insurance client at the onset of the HealthCare.gov integration and enrollment reconciliation.
Consultant
2012 - 2013
- Worked to integrate and analyze data from multiple clients connecting to an array of EHR (Electronic Health Record System) and Health Plan data sources.
- Led the UX/UI effort for the creation of a large custom enterprise application.
Automated Splitting of Document Packages and Identification of Relevant Documents
A document splitting and identification model developed at Iron Mountain for large lender clients.
View published patent →Where I spend my time
Enterprise AI & Search
My current work centers on enterprise AI search at Lucidworks: semantic and hybrid retrieval and grounded RAG for knowledge-management and e-commerce use cases, measured with relevance metrics like nDCG and MRR. It builds on more than a decade of selling, implementing and supporting SaaS platforms for data integration and analytics, including Treasure AI's CDP and Arcadia's analytics platform.
Agentic AI & LLM Applications
I build LLM applications that go beyond a single prompt: agents that call tools, query routing that pairs model judgment with deterministic logic, retrieval grounded in structured data, MCP integrations, and structured outputs that downstream systems can rely on. This spans customer prototypes and my own projects.
Machine Learning
Have developed my own predictive models, as well as designed architectures for deploying ML workflows with monitoring, iteration, and feedback loops. At Iron Mountain, my team and I received a patent for a document splitting and identification model that we developed for our large lender clients. At Arcadia, while using clinical, claims, and demographic data I built a model to predict how likely a patient would be a "No Show" to their doctor’s appointment.
Product Management
Experience with Agile methodologies (Scrum, Kanban), grooming and planning backlogs. Experienced as a Jira Admin, creating, managing and supporting project workflows. My technical experience is a large asset in communicating with and gaining the trust of engineers. I have experience serving as product owner for platform, web, as well as internal automation and telemetry products.
Database Expertise
Highly experienced with creating, managing and architecting databases. Very strong SQL skills and have created very complicated queries, stored procedures as well as integrations via APIs to external systems. Both SQL and NoSQL databases. Have conducted data model designs, database development standards, implementation and management of data warehouses and data analytics systems.
Cloud & Enterprise Architecture
I've worked across AWS, Azure and GCP, with years of experience using and architecting cloud services and software, including data products like Snowflake, Databricks, Splunk and Elastic. I design cloud architectures across batch, streaming, serverless and containerized deployments.
Technical Discovery & Business Value
Good solutions start with understanding the business problem. I've worked across healthcare, insurance, consumer and pharma, presented to C-suite executives, and spent years client-facing, starting with weekly onsite consulting. Outside of work I keep up with business and tech news and review the quarterly earnings of public companies I follow.
Data-Driven Solution Design
As an industrial engineer by training, I have a mind for process improvement, efficiency and using data to make decisions. I'm Six Sigma certified and believe in measuring outcomes, which is how I approach solution design: define the problem and the metric, build, then measure the improvement.
Full-Stack Prototyping & Integration
I write full-stack applications and prototypes in Python, Node.js, JavaScript/TypeScript and SQL, integrating data from external systems through APIs, message queues, ETL pipelines and webhooks. I'm comfortable with common front-end libraries including D3, Bootstrap and Angular.
Interactive Data Visualization & D3.js
I build custom interactive dashboards and data visualizations using D3.js, JavaScript, Python, SQL, and APIs. My projects include real-time ETL monitoring, healthcare data-quality analysis, workflow capacity planning, financial dashboards, and search evaluation tools — some of them are in the portfolio below.
I enjoy building visualizations that go beyond standard BI charts, using custom interactions, drilldowns, and data models to make complex systems understandable and actionable. I've also worked with Tableau, Power BI, Qlik, QuickSight, Sisense, and Adobe Illustrator.
Things I've built
Dashboards, models and data tools — mostly built end to end. Step through the sets below; hover any frame for the detail.
Search Success Metrics
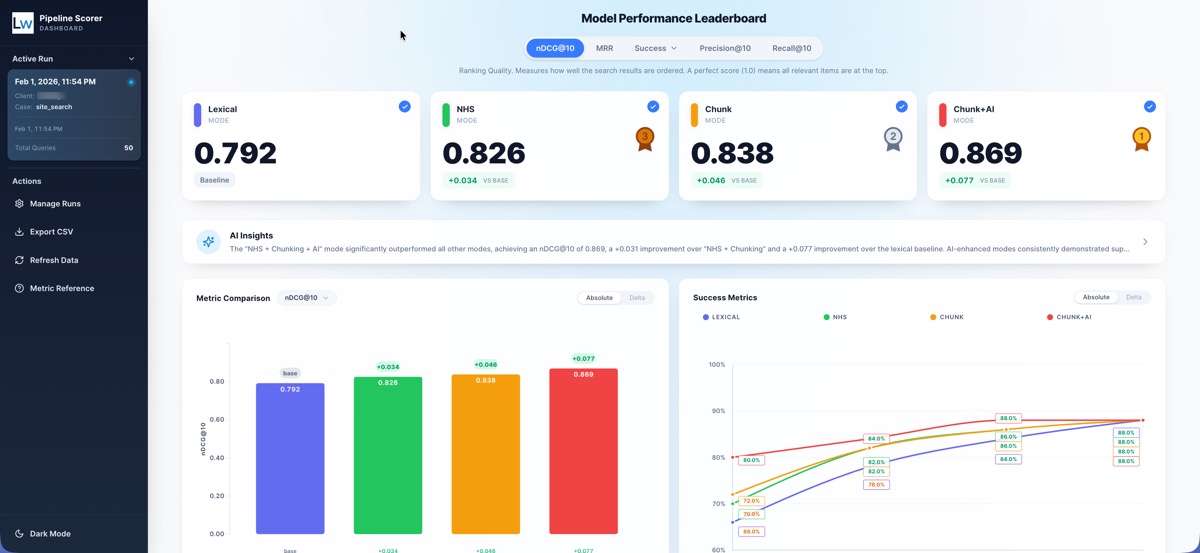
Developed an interactive evaluation framework combining nDCG, MRR, Success@K, and LLM-as-Judge to compare search strategies. In a customer evaluation, it measured an nDCG@10 improvement from 0.792 to 0.869 across four retrieval configurations.
Developed an interactive evaluation framework combining nDCG, MRR, Success@K, and LLM-as-Judge to compare search strategies. In a customer evaluation, it measured an nDCG@10 improvement from 0.792 to 0.869 across four retrieval configurations.
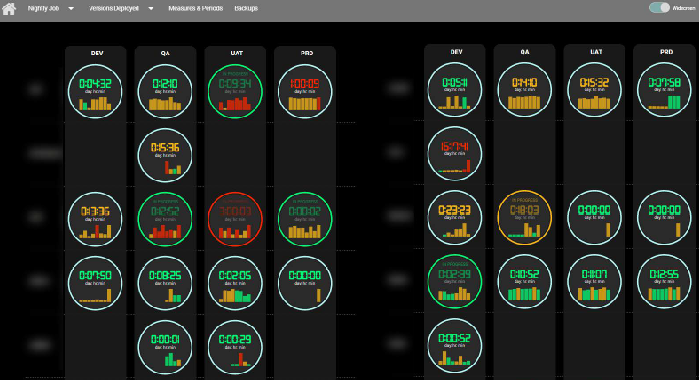
A real-time database job monitoring dashboard I created, using D3 in the front end, Node.js and SQL Server in the back-end.
A real-time database job monitoring dashboard I created, using D3 in the front end, Node.js and SQL Server in the back-end.
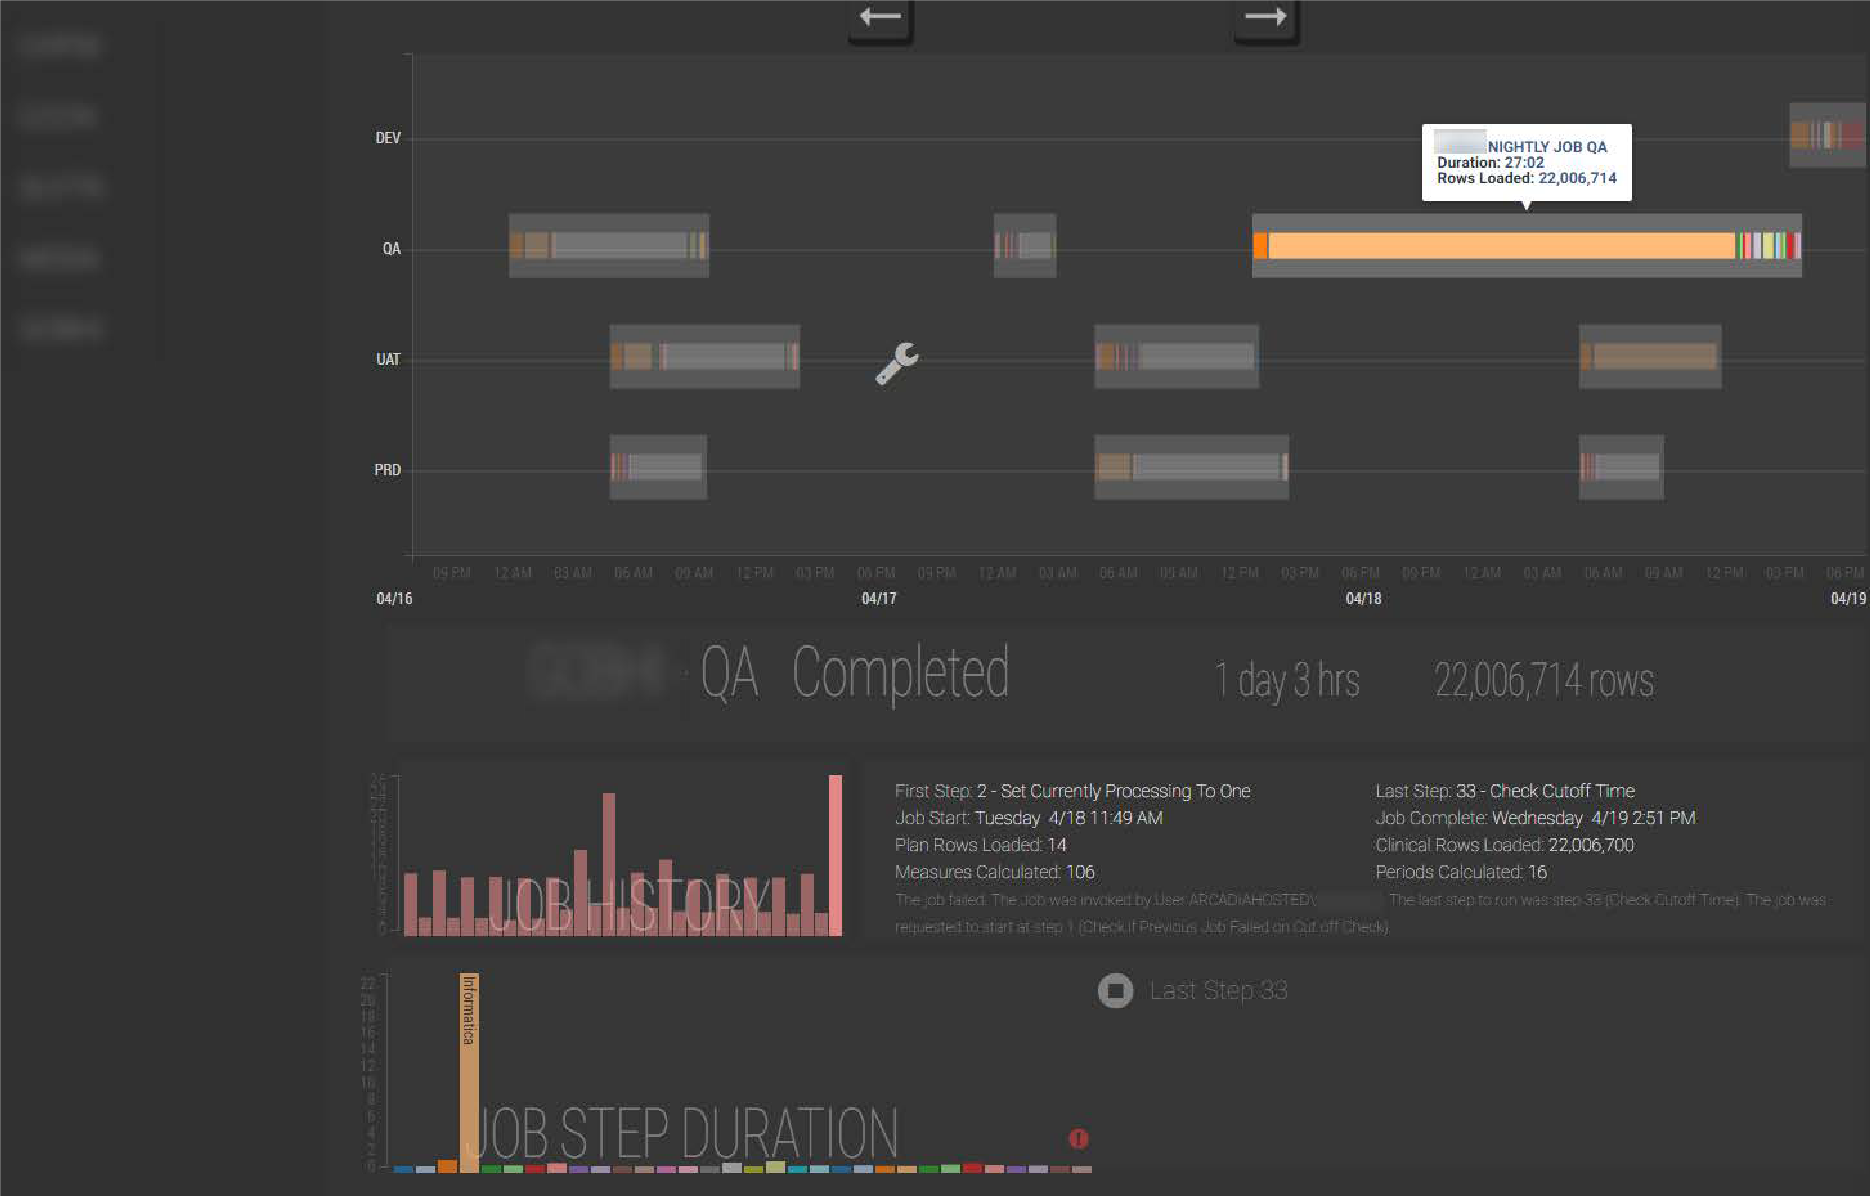
Built an interactive ETL monitoring application with execution timelines, environment comparisons, processing metrics, and failure diagnostics. Used D3.js to visualize complex processing pipelines, including jobs handling tens of millions of records.
Built an interactive ETL monitoring application with execution timelines, environment comparisons, processing metrics, and failure diagnostics. Used D3.js to visualize complex processing pipelines, including jobs handling tens of millions of records.
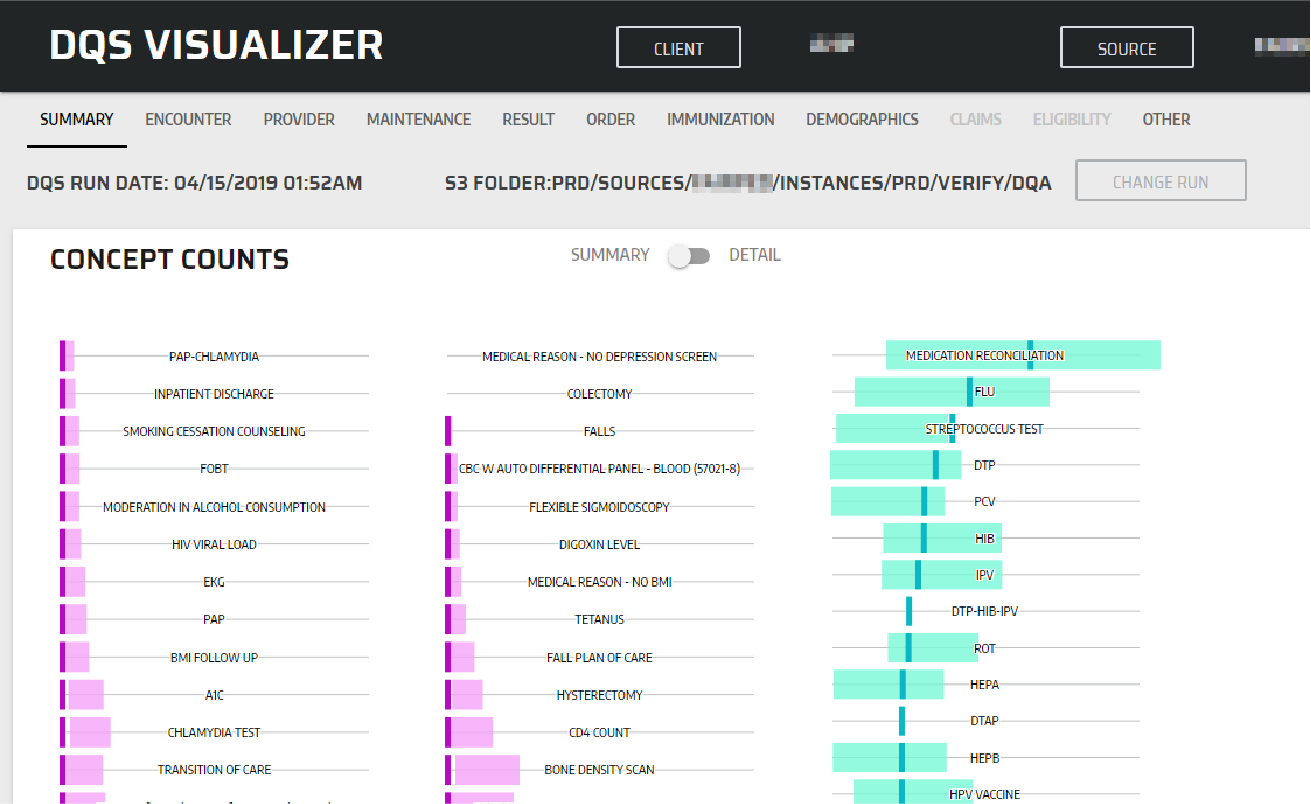
A data-quality monitor I custom-built: Node.js and Python aggregate millions of rows of raw data from S3 and generate these D3 dashboards on the fly, benchmarked by domain. It profiles the data ahead of the long ETL run, so anomalies surface before processing.
A data-quality monitor I custom-built: Node.js and Python aggregate millions of rows of raw data from S3 and generate these D3 dashboards on the fly, benchmarked by domain. It profiles the data ahead of the long ETL run, so anomalies surface before processing.
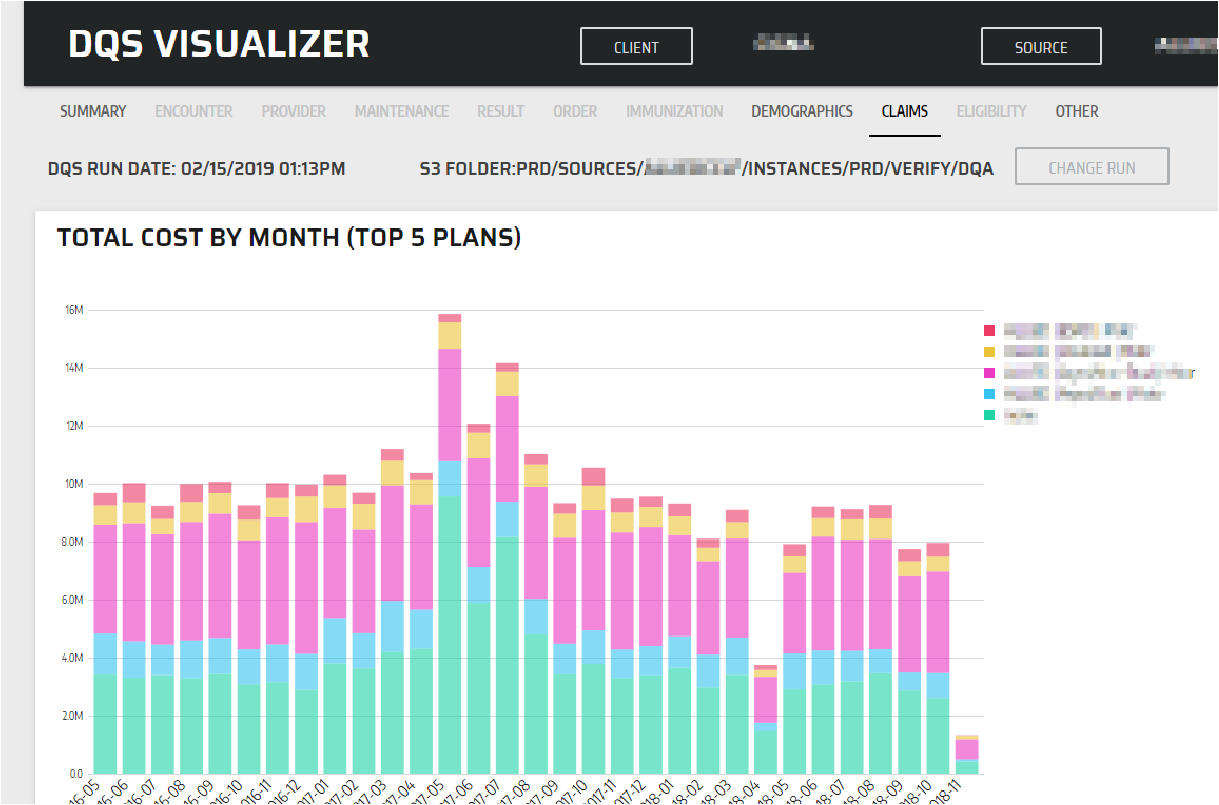
The same raw-data view for claims. A plan's totals falling off or drifting from the benchmark signal a mapping or transformation issue.
The same raw-data view for claims. A plan's totals falling off or drifting from the benchmark signal a mapping or transformation issue.
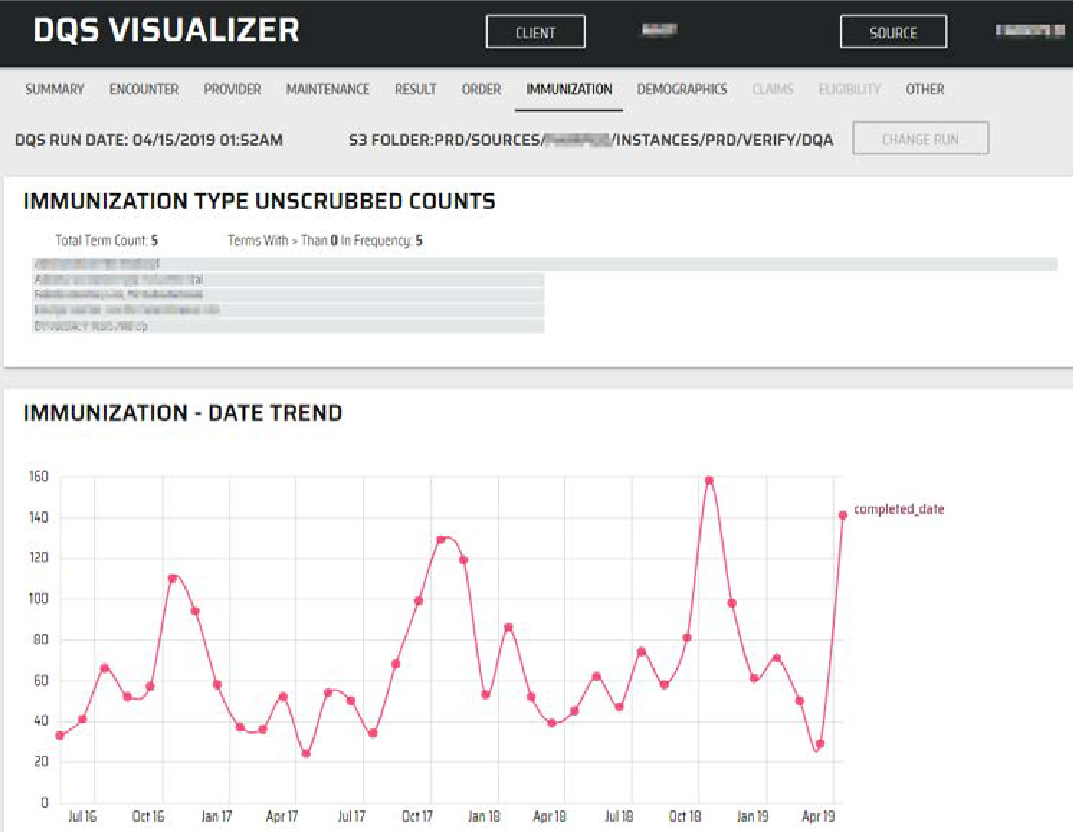
The immunization view of that raw data. Counts dropping off or terms that don't match the benchmark point to a coding or mapping issue before the batch run.
The immunization view of that raw data. Counts dropping off or terms that don't match the benchmark point to a coding or mapping issue before the batch run.
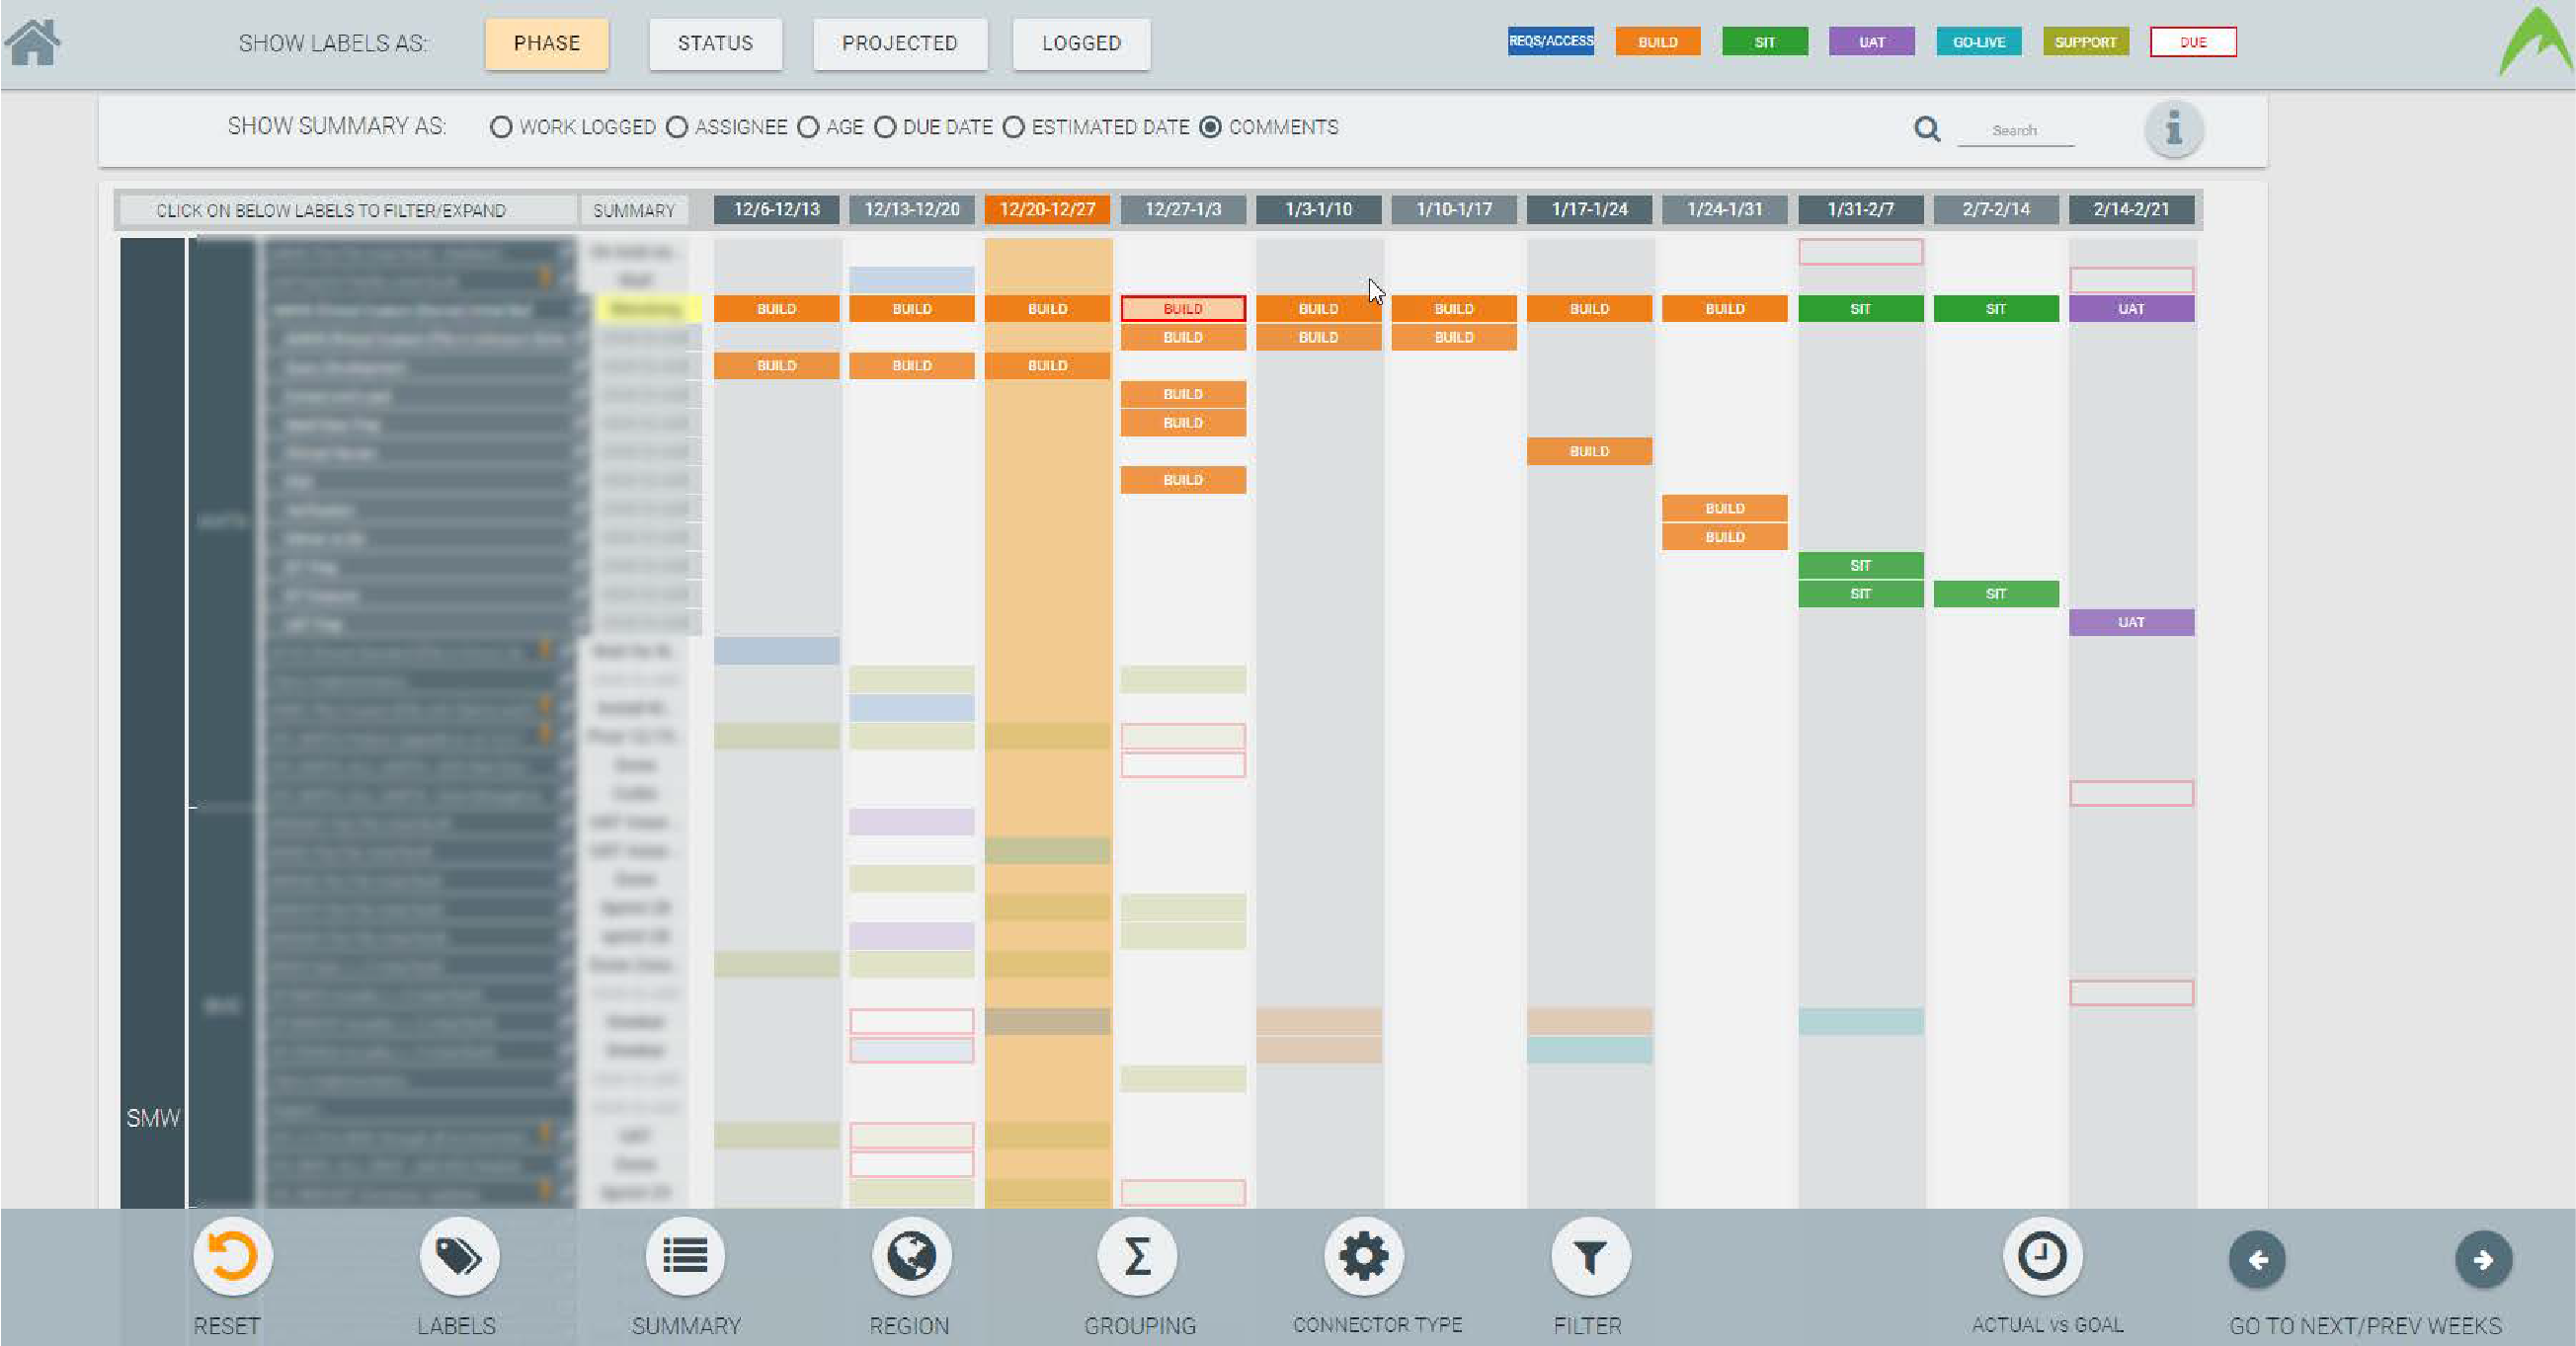
Interactive work scheduling application I developed using a myriad of data sources including a python JIRA API integration, as well as data collected from database, and logs & files from AWS.
Interactive work scheduling application I developed using a myriad of data sources including a python JIRA API integration, as well as data collected from database, and logs & files from AWS.
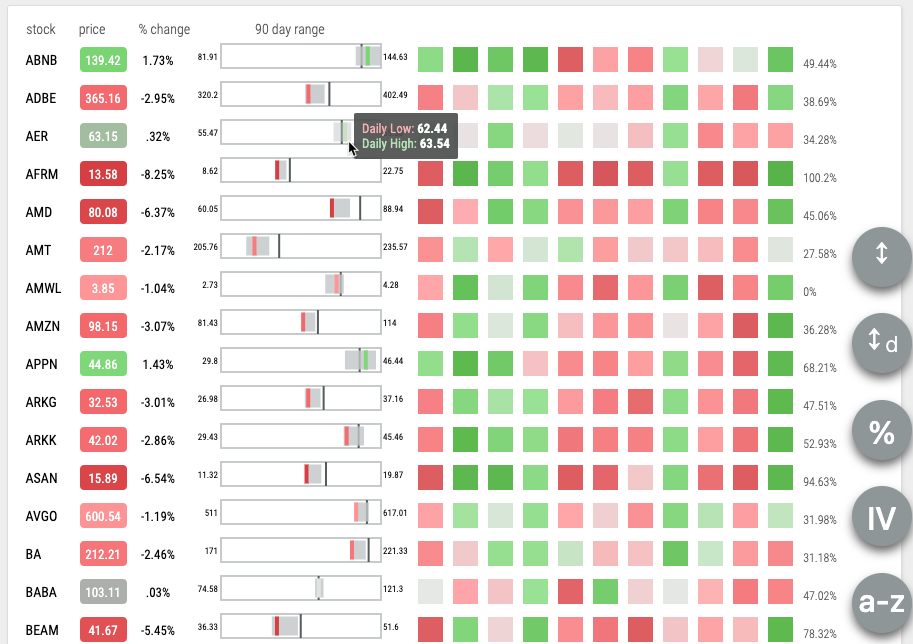
Using a GCP cloud function, running a python script to obtain latest stock data from yahoo finance API for a set of stocks on my watchlist. The output is displayed in real time, in a custom chart made using D3.
Using a GCP cloud function, running a python script to obtain latest stock data from yahoo finance API for a set of stocks on my watchlist. The output is displayed in real time, in a custom chart made using D3.
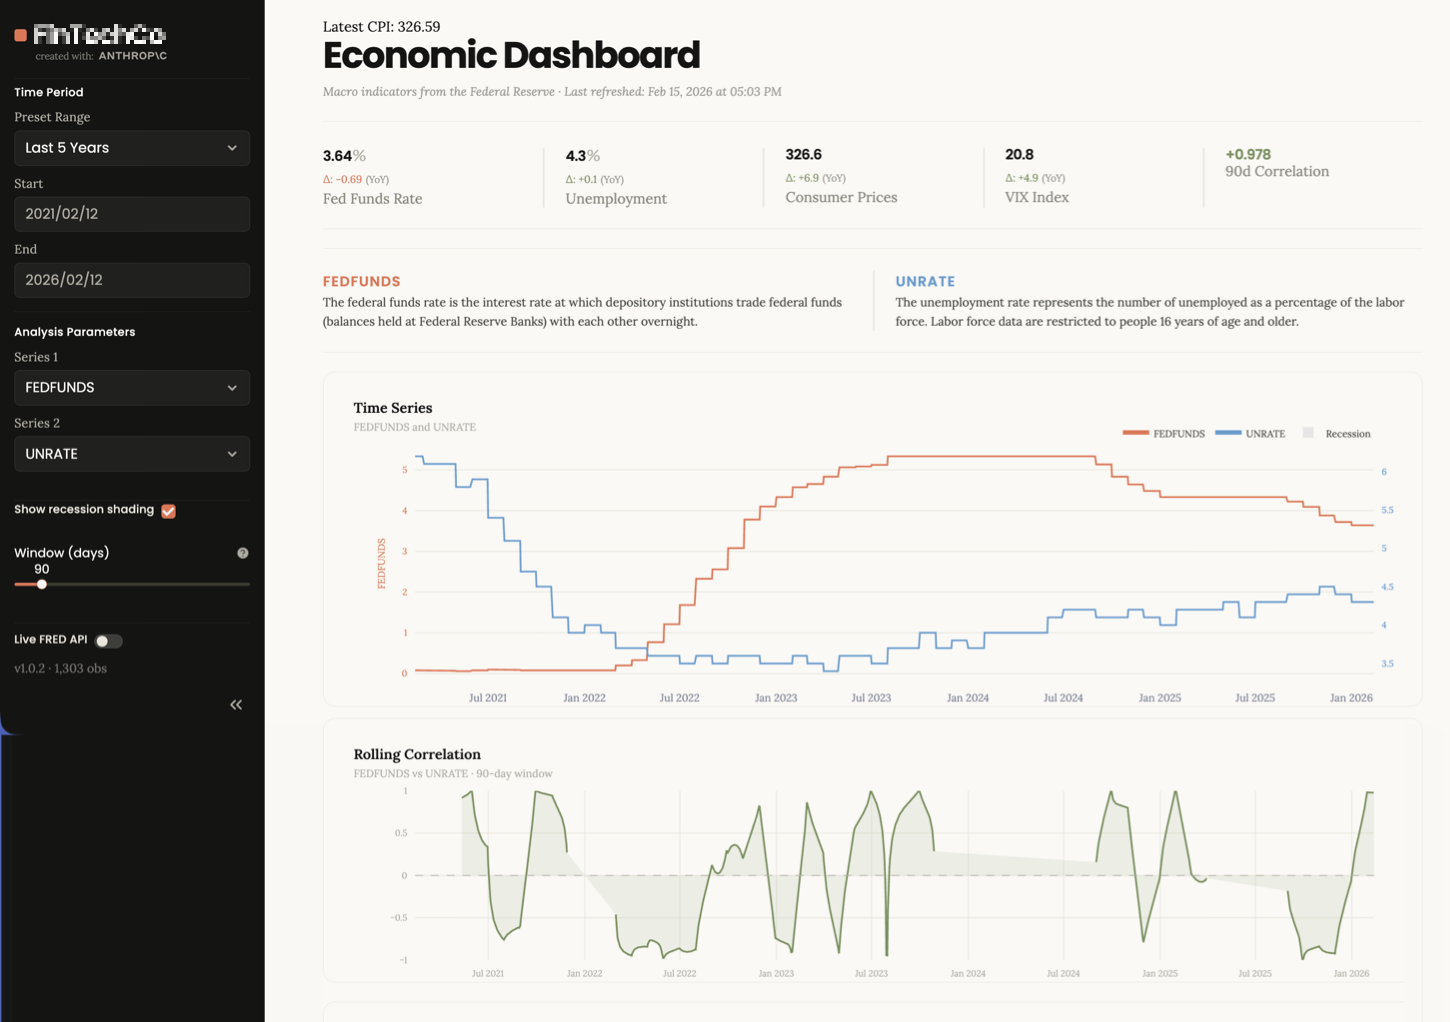
Built an interactive macroeconomic dashboard that pulls live Federal Reserve (FRED) data to track key indicators over time and analyze how they relate — series, time ranges, recession shading, and rolling correlation windows.
Built an interactive macroeconomic dashboard that pulls live Federal Reserve (FRED) data to track key indicators over time and analyze how they relate — series, time ranges, recession shading, and rolling correlation windows.
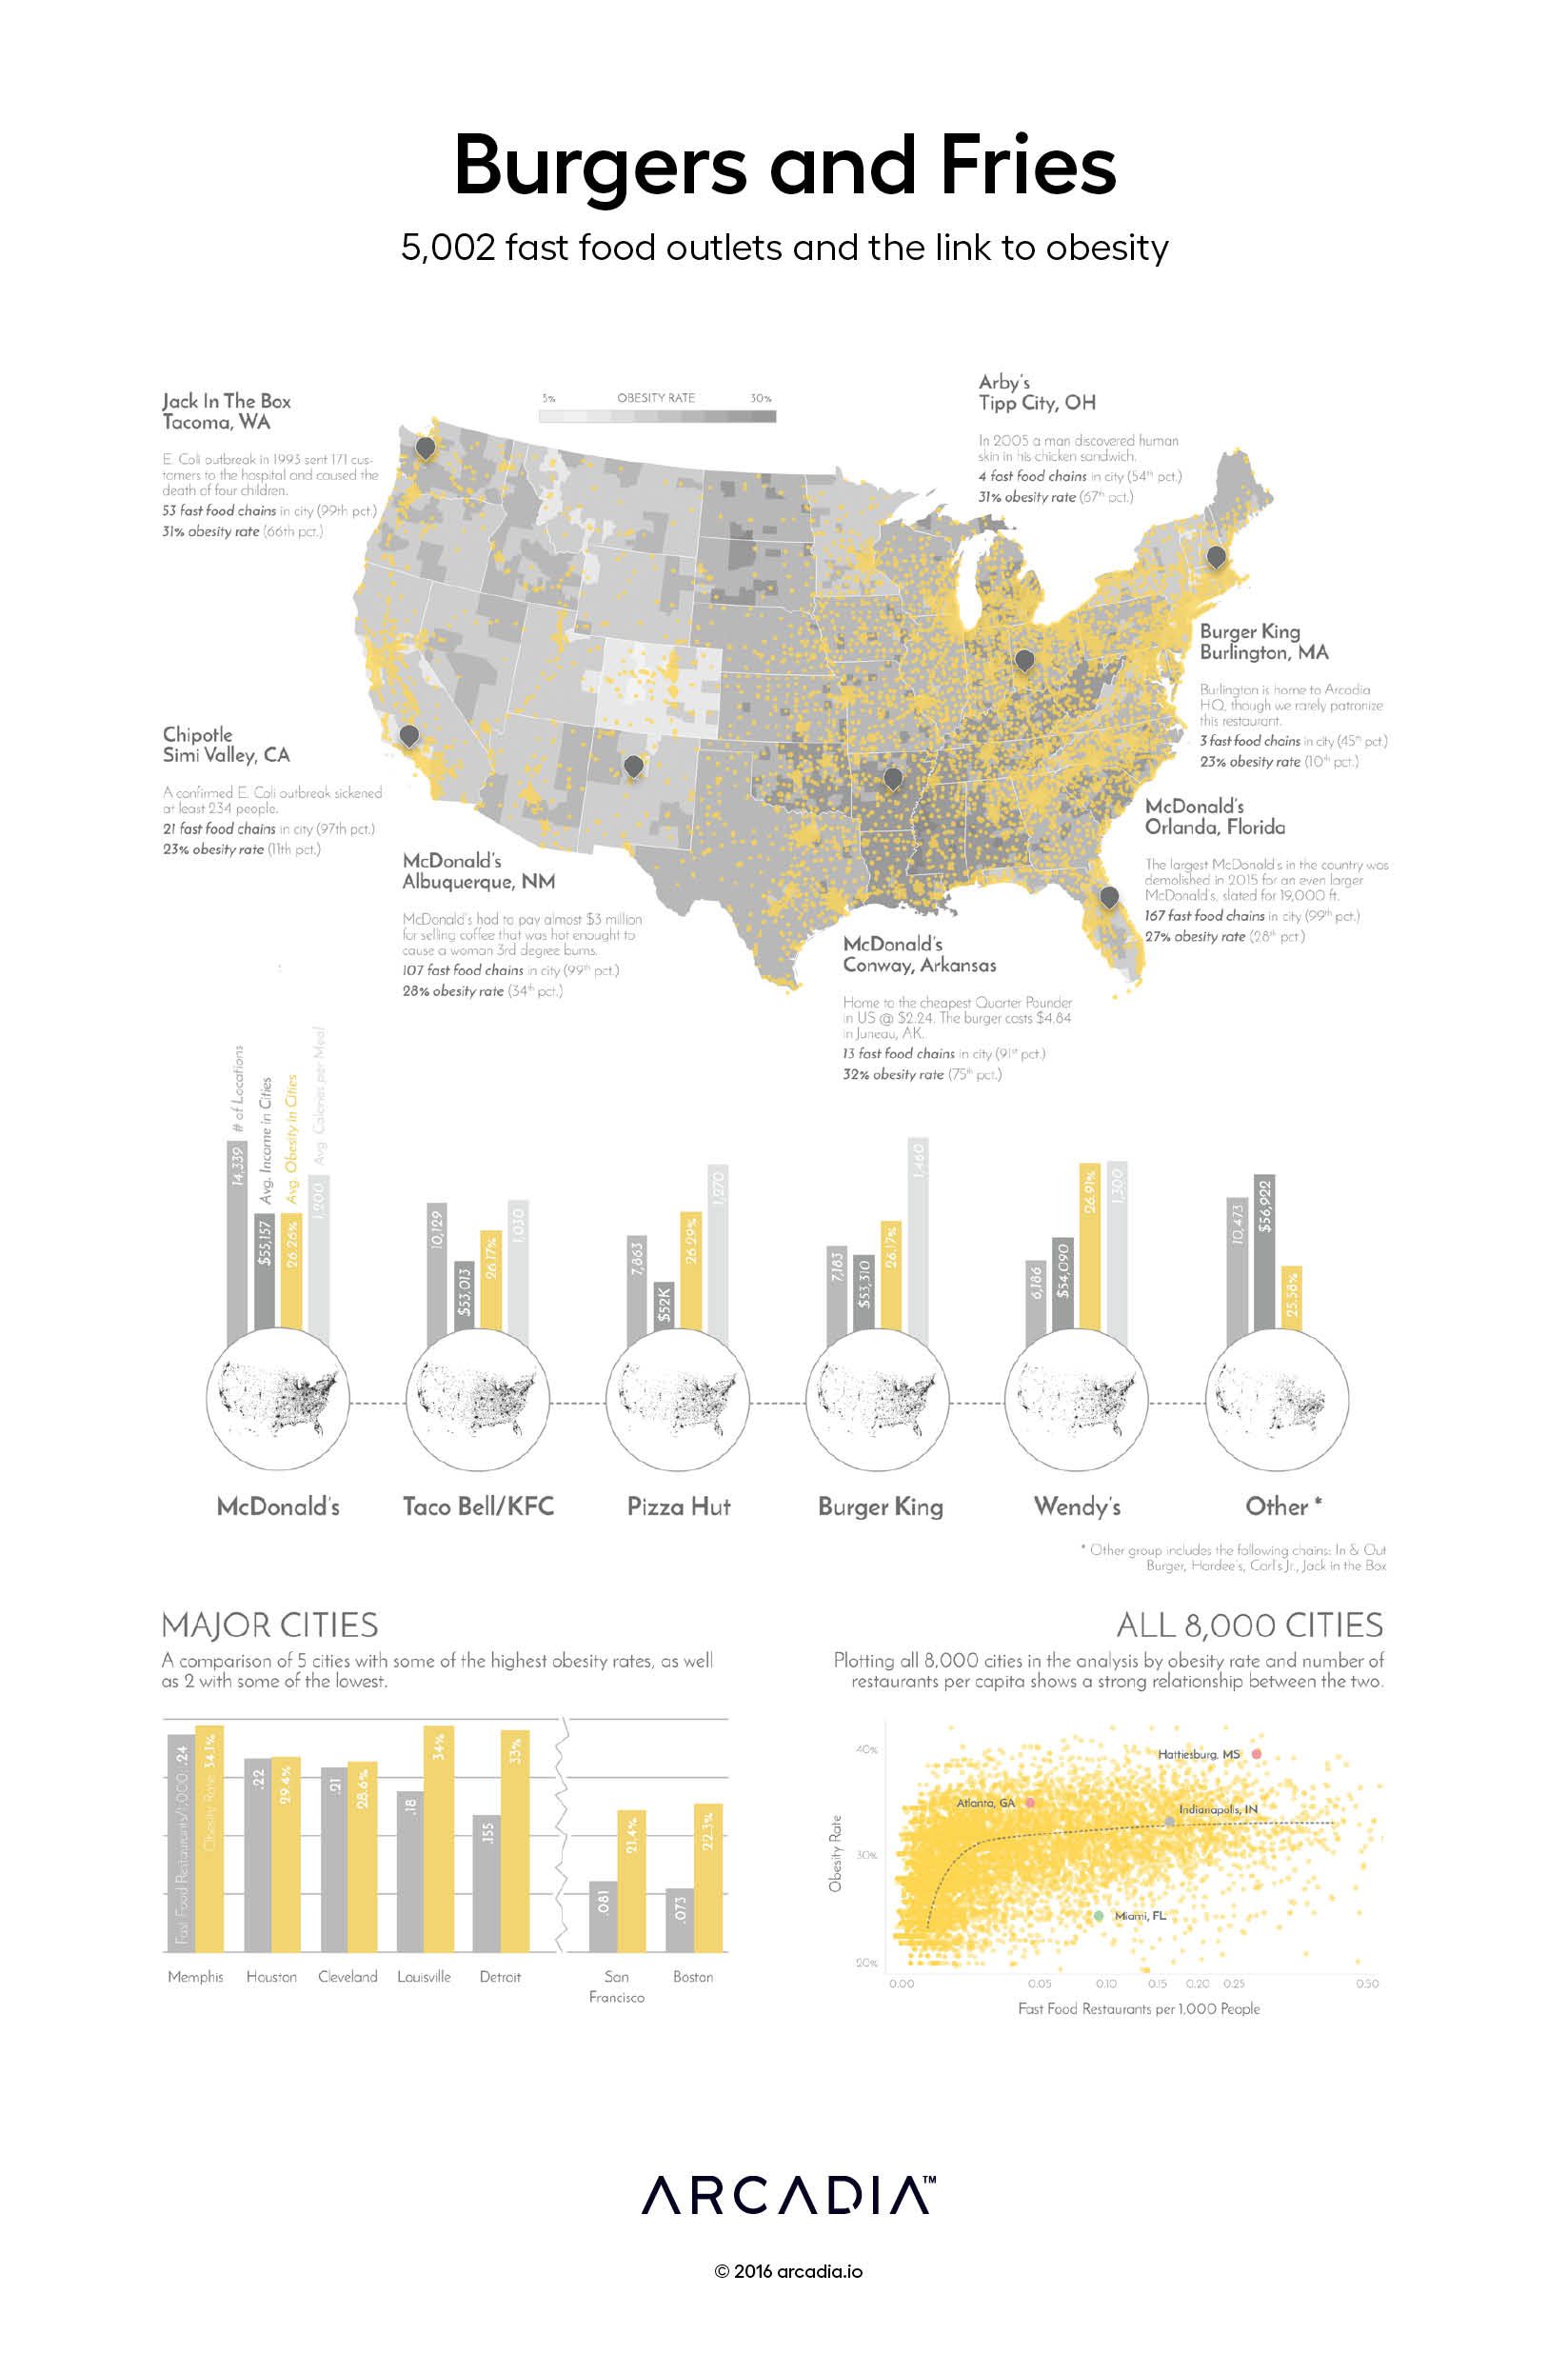
Infographic for a poster used at a conference, made in D3 and Adobe Illustrator, using publicly available data.
Infographic for a poster used at a conference, made in D3 and Adobe Illustrator, using publicly available data.
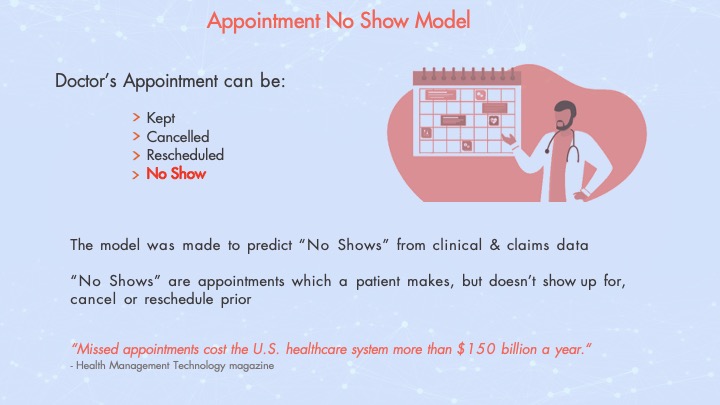
I built this model to predict “no shows” from clinical and claims data: appointments a patient books but then doesn’t attend, cancel or reschedule.
I built this model to predict “no shows” from clinical and claims data: appointments a patient books but then doesn’t attend, cancel or reschedule.
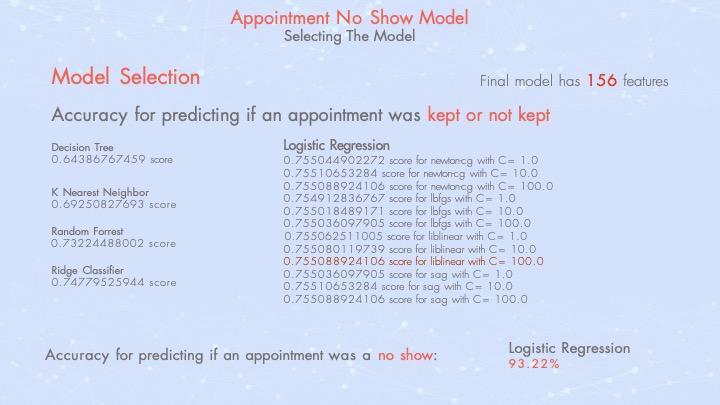
To choose the model, I compared decision tree, k-nearest neighbors, random forest, ridge classifier and logistic regression, tuning the hyperparameters for each.
To choose the model, I compared decision tree, k-nearest neighbors, random forest, ridge classifier and logistic regression, tuning the hyperparameters for each.